AUSTRALIAN CAPITAL TERRITORY
HOW HAVE PERSONAL CRIME VICTIMISATION RATES CHANGED OVER TIME?
No graph for personal crimes in the Australian Capital Territory is presented, as no fitted functions or data series met the criteria for inclusion.
HOW HAVE HOUSEHOLD CRIME VICTIMISATION RATES CHANGED OVER TIME?
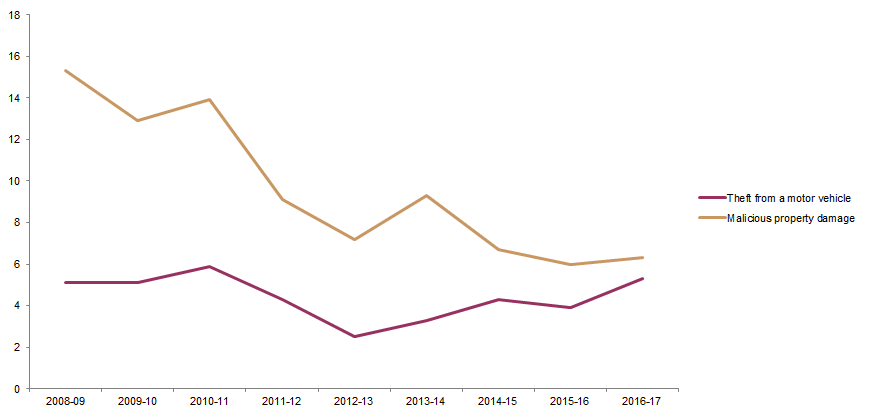
Although no fitted functions that met the inclusion criteria were identified for malicious property damage in the Australian Capital Territory, when undertaking significance testing (comparing two time points) the victimisation rate for malicious property damage was significantly lower in 2016-17 (6.3%) compared to 2008-09 (15.3%).
No fitted functions that met the inclusion criteria were identified for theft from a motor vehicle in the Australian Capital Territory, nor was there any significant difference in the victimisation rate for theft from a motor vehicle between 2008-09 and 2016-17.
VICTIMISATION RATES, Selected household crimes, Australian Capital Territory, 2008-09 to 2016-17(a)
Australian Bureau of Statistics
© Commonwealth of Australia 2018.
Footnote(s): (a) Data for break-in, attempted break-in, motor vehicle theft, and other theft are not shown, as estimates for the number of households experiencing these crime types during the 12 months prior to interview are subject to high sampling error (for further details refer to the Technical Note).
 Quality Declaration
  Print Page
 Print All